Full Network Analysis
Demonstrates using analyze_many() to perform a comprehensive modal analysis across all buses in a network.
This example shows how to:
Use
analyze_many()to compute modes for every bus in the network.Generate a peak density heatmap to visualize system-wide modal patterns.
Interpret the resulting wavelength-frequency plot.
from sgwt import SGMA
from sgwt import DELAY_WECC as L

# Signals: Real or Complex Matrix (Rows: Buses, Cols: Time)
V, t = get_signal(FILEPATH, t_range=(0, 60))
V = np.abs(V)

# SGMA Parameters
TIME_TARGET = 2.0
ORDER = 3
TOP_N = 3

spatial_scales = np.geomspace(1e-3, 1e1, 150)
temporal_freqs = np.linspace(0.02, 2.0, 100)
sgma = SGMA(L, scales=spatial_scales, freqs=temporal_freqs, order=ORDER)

result = sgma.analyze_many(V, t, time=TIME_TARGET, top_n=TOP_N)
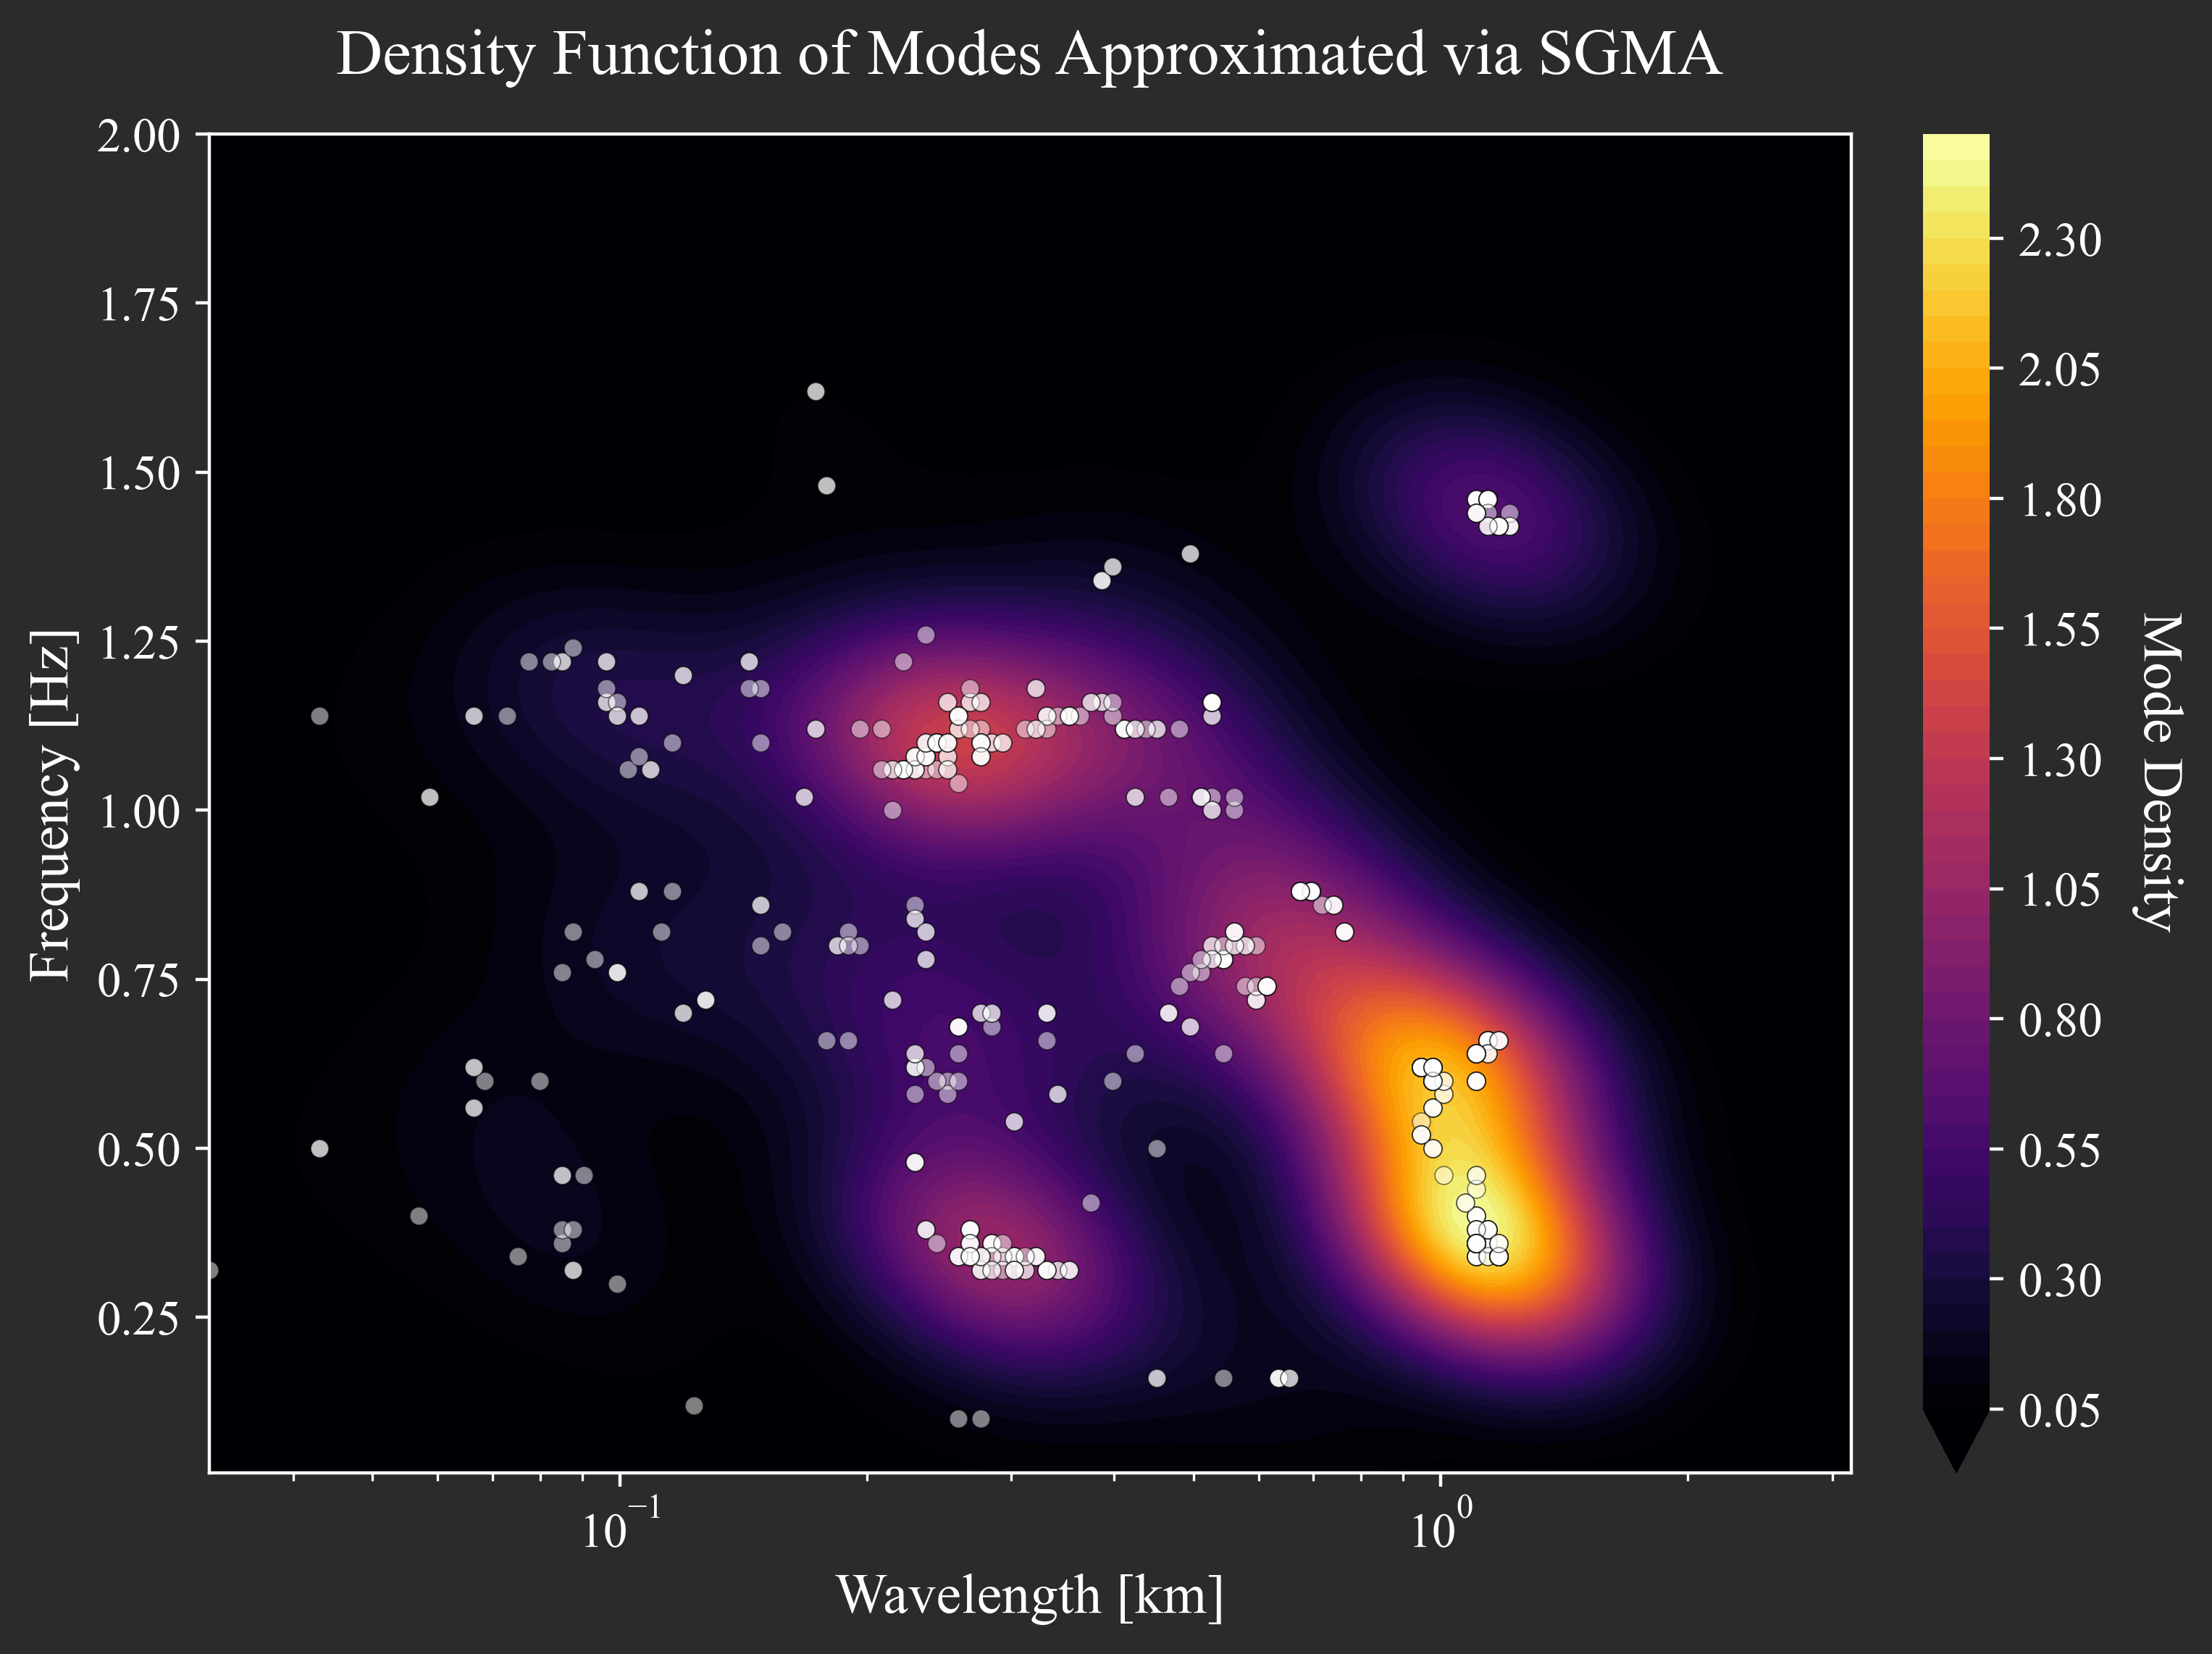
By calling analyze_many() without the buses argument, the analysis runs on all buses in the graph. The resulting heatmap visualizes the density of all detected peaks. Hotspots on the map indicate dominant modes that are present across many buses in the system.
Wavelength (y-axis): Larger wavelengths correspond to wide-area inter-area modes, while smaller wavelengths indicate local modes.
Frequency (x-axis): Identifies the temporal frequency of the oscillation in Hz.