Modal Analysis on a Bus Subset
Demonstrates using analyze_many() to efficiently identify oscillatory modes across a subset of buses.
This example shows how to:
Analyze a random subset of buses to get a representative view of network-wide modes.
Use the
analyze_many()method for efficient batch processing.Visualize the combined peaks from all analyzed buses on a heatmap.
Analysis on a Subset of Buses
from sgwt import SGMA
from sgwt import DELAY_WECC as L

# Signals: Real or Complex Matrix (Rows: Buses, Cols: Time)
V, t = get_signal(FILEPATH, t_range=(0, 60))

# SGMA Parameters
TIME_TARGET = 2.0
N_RANDOM_BUSES = 50
ORDER = 3
TOP_N = 3

spatial_scales = np.geomspace(1e-3, 1e1, 150)
temporal_freqs = np.linspace(0.02, 2.0, 100)
sgma = SGMA(L, spatial_scales, temporal_freqs, order=ORDER)

subset_buses = np.random.choice(L.shape[0], N_RANDOM_BUSES, replace=False)
result = sgma.analyze_many(V, t, time=TIME_TARGET, buses=subset_buses, top_n=TOP_N)
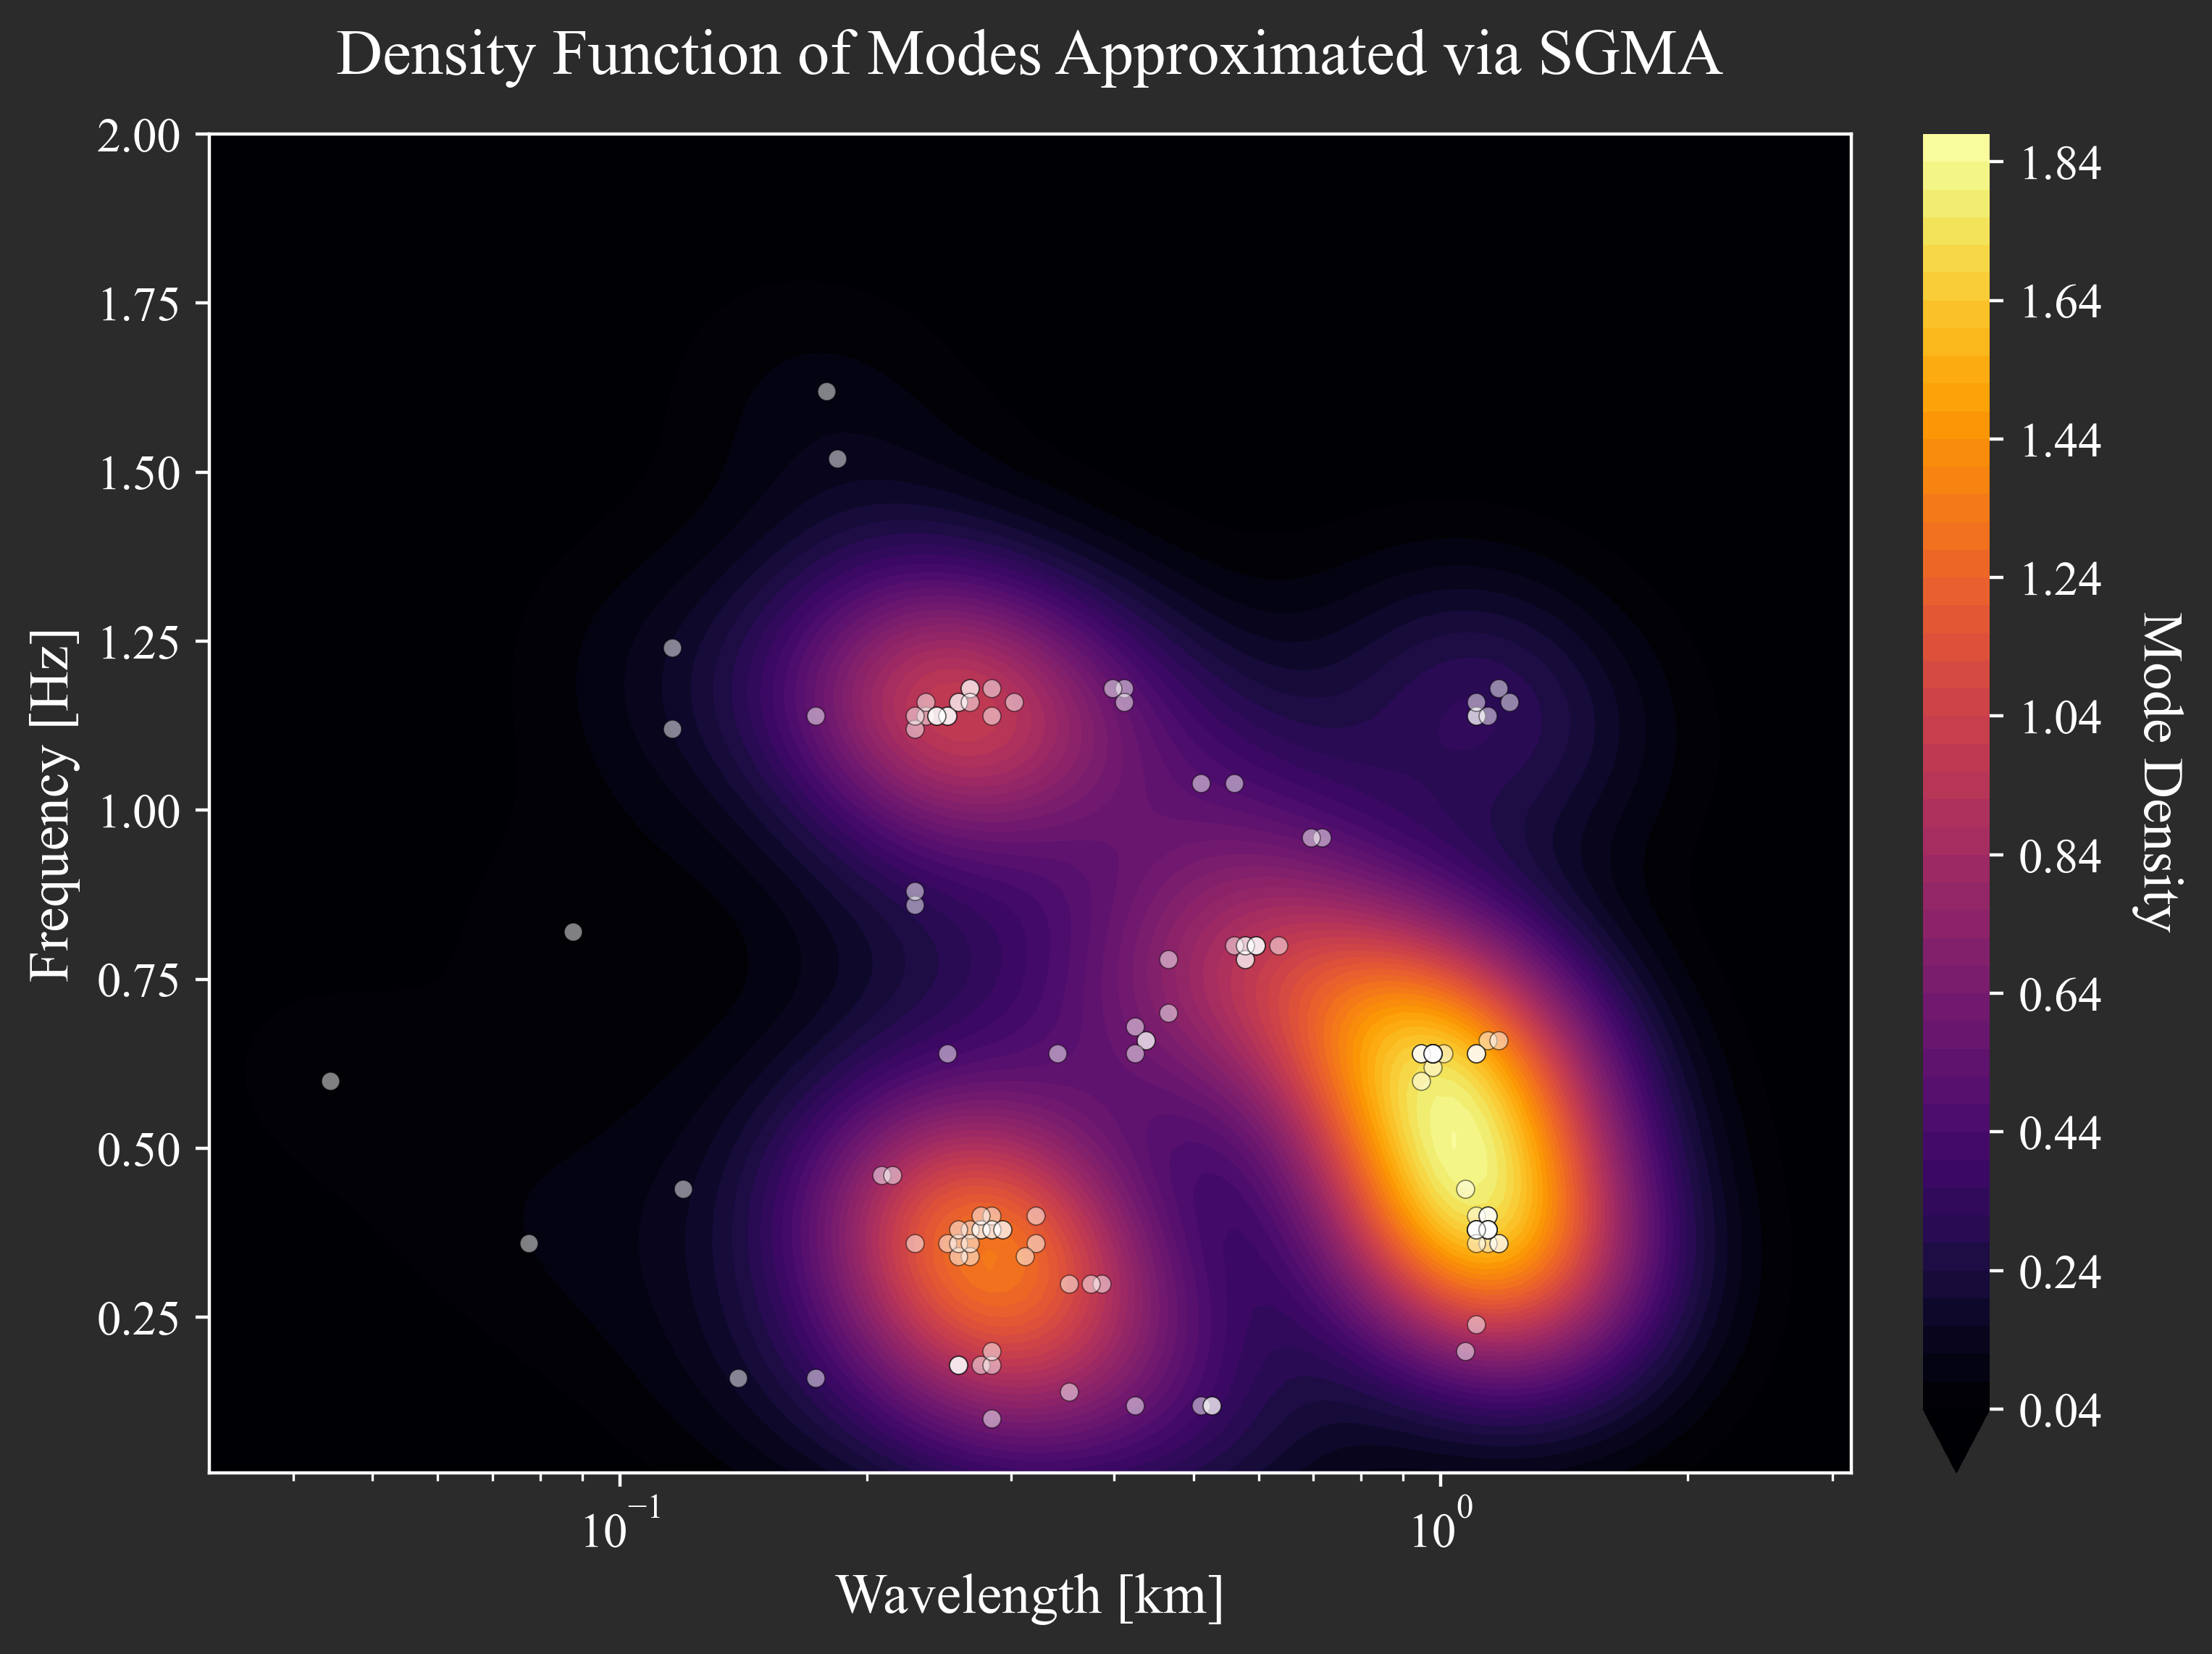
The analyze_many() method is highly efficient because it computes the temporal transform V @ B only once and reuses it for each bus. The resulting heatmap shows all detected peaks, providing a picture of the dominant modes present in the selected subset of the network.